1.2 Solutions
- Create a script and call it assignment01. Save your script.
- Download this cheat-sheet and go over it. You won’t understand most of it right away. But it will become a useful resource. Look at it often.
- Calculate the square root of 1369 using the
sqrt()function. - Square the number 13 using the
^operator. - What is the result of summing all numbers from 1 to 10?
- Load up the default data
quakesfromRin the same way you loaded thewomendata. Use?quakesto find out more about this dataset.
- Look at the first 6 rows of
quakes. - Using the
[Row, Column]approach, find out how many stations reported the 18th earthquake in the dataset. - Extract the
magcolumn from thequakesdataset using the$operator. Call this new objectquake_mags. - Generate a simple plot of the number of stations reporting an earthquake (
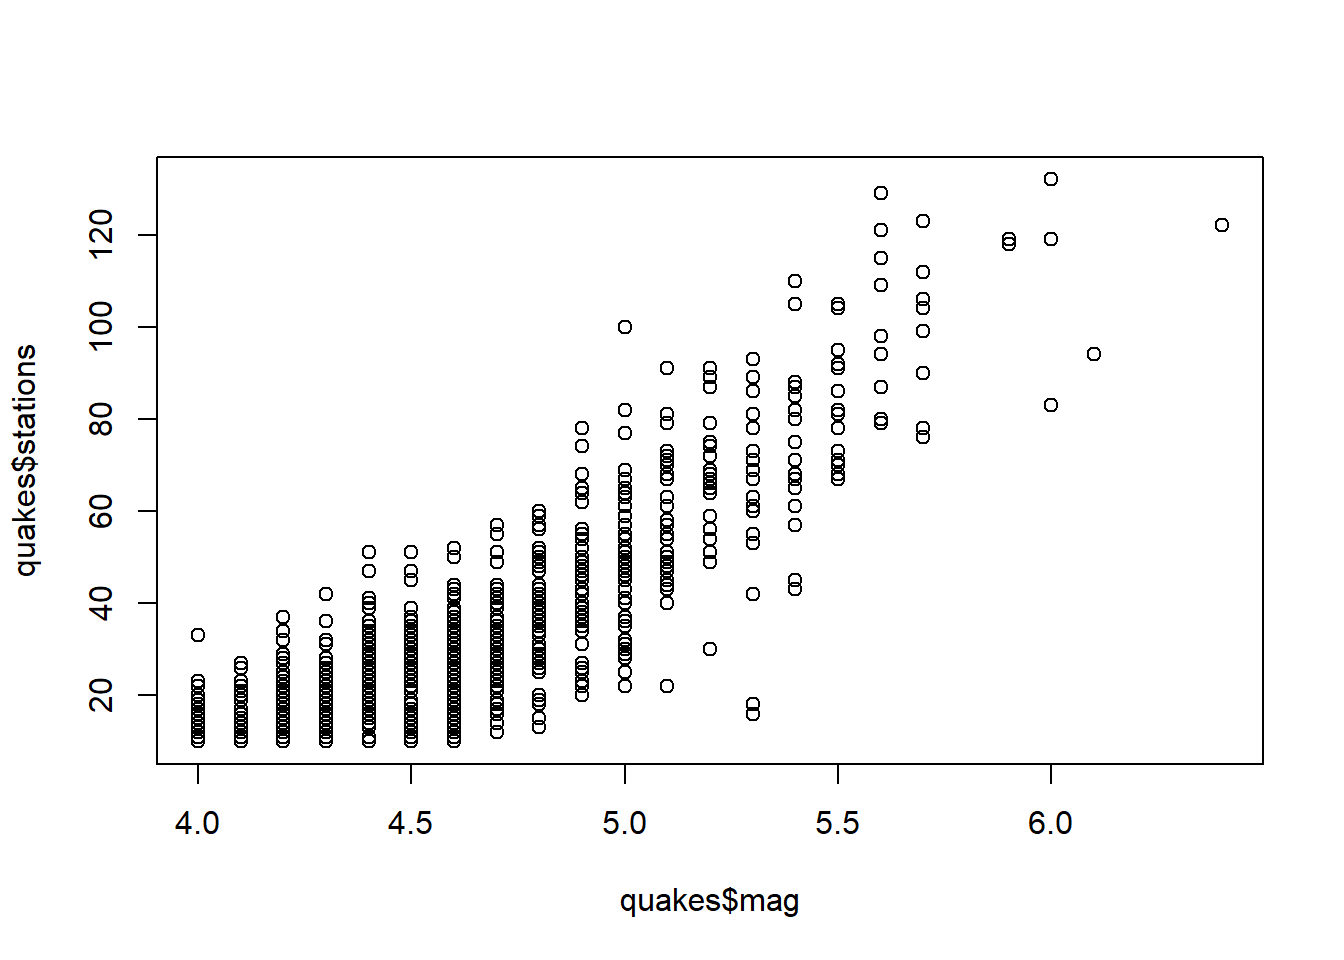
stations) by its magnitude (mag). What do you notice about the relationship? Why might this be the case?
- Save your R script by pressing the Save button in the script window.
1.2.1 Exercise 3
Calculate the square root of 1369 using the sqrt() function.
sqrt(1369)[1] 371.2.2 Exercise 4
Square the number 13 using the ^ operator.
13^2[1] 1691.2.3 Exercise 5
What is the result of summing all numbers from 1 to 100?
# long solution
result <- sum(1, 2, 3, 4, 5, 6, 7, 8, 9, 10)

# quick solution
result <- sum(1:10)
The result is 55.
1.2.4 Exercise 6
Load up the default data quakes from R in the same way you loaded the women data. Use ?quakes if you want to find out more about this dataset.
# load up dataset
data('quakes')
Look at the first 6 rows of quakes.
# look at first 6 rows
head(quakes)
lat long depth mag stations
1 -20.42 181.62 562 4.8 41
2 -20.62 181.03 650 4.2 15
3 -26.00 184.10 42 5.4 43
4 -17.97 181.66 626 4.1 19
5 -20.42 181.96 649 4.0 11
6 -19.68 184.31 195 4.0 12Using the [Row, Column] approach, find out how many stations reported the 18th earthquake in the quakes dataset.
# need the 18th row of the fifth column
quakes[18,5]
[1] 21Extract the mag column from the quakes dataset using the $ operator. Call this new object quake_mags.
# earthquake magnitudes
quake_mags <- quakes$mag
Generate a simple plot of the number of stations reporting an earthquake (stations) by its magnitude (mag).
# scatterplot
plot(quakes$mag, quakes$stations)